Phil Phillips, Contributing Editor04.09.18
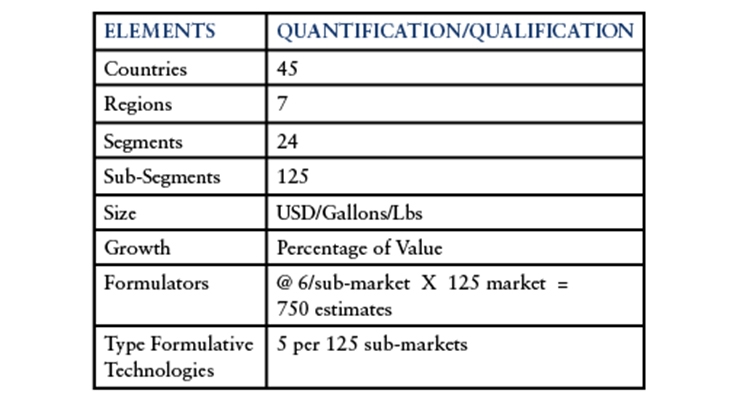
The Global Coatings & Paints Segmentation has three Strategic Groupings . . . . Product OEM, Special Purpose and Architectural. Within the Product OEM Strategic Group, there are eight Industrial Coating Segments with 86 Sub-Segments. Of the 86 Sub-Segments and, within the 8th Industrial Coating segment . . . . . GENERAL FINISHING, there are 24 Sub-Segments with 125 Sub, Sub-Segments.
Fragmentation
This consideration addresses an extremely fragmented and disjointed set of elements. The following table provides the complication in analytics, running through this deliberation.
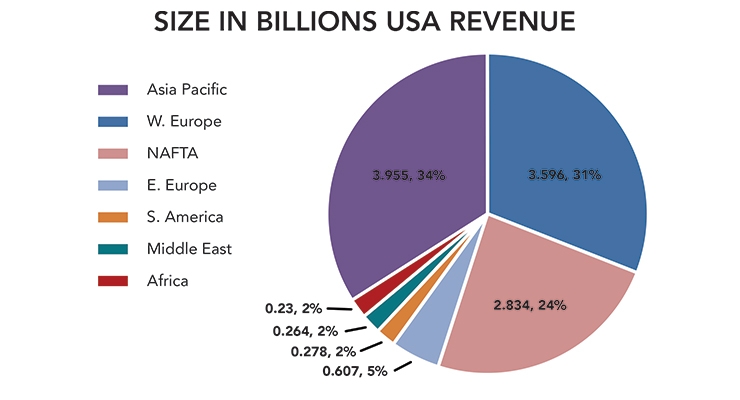
Of the seven regions in this analysis totaling $11.8 billion U.S. dollars, the rank order in share of the global General Finishes marketplace are:
Asia/Pacific at 34% leads
Western Europe at 31%
NAFTA at 24%
Eastern Europe at 5%; South America; Middle East and Africa at 2% each are small but growing.
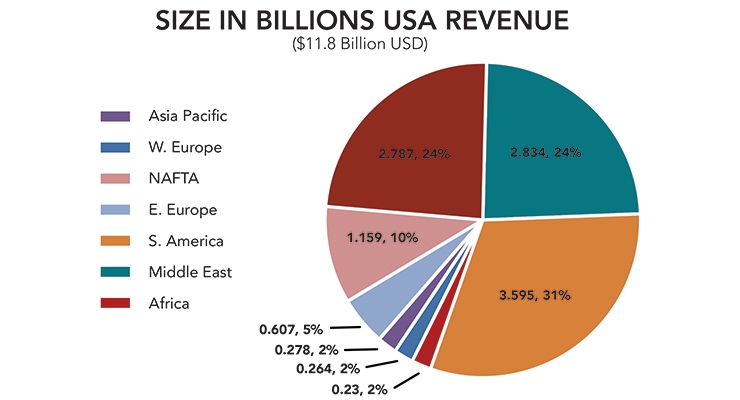
If Japan at $1.157 Bn was segmented out of the Asia/Pacific numbers, the order would be:
Western Europe at 31%
NAFTA at 24%
Asia/Pacific at 24%
Japan at 10%
Eastern Europe at 5%; South America; Middle East and Africa at 2% each are small but growing.
From a macro oversight, the (details) tells us that 11 of the 125 sub-segments analyzed represents 40.4% of the total value and another 8, totaling 19 sub-segments, would bring the percent share to 53.3% ($7.8 Bn) of the $11.8 Bn total.
Within the 40.4% (11 sub-segments) the range of size is $2.3 Bn (Metal Furniture) to the lowest $0.8 Bn for Wire Products.
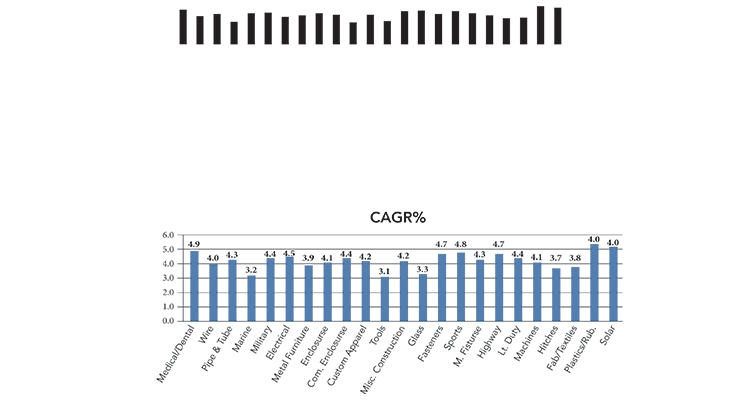
Considering the compound average growth rates of the 24 major segments, we see the following pattern: Falling below the 4% CAGR are . . . . Marine, Metal Furniture, Tools, Hitches and Fabric/Textiles. Of these lower growth segments, one must be careful not to relegate too much weight to growth alone since, in this case, Metal Furniture at 3.9% CAGR is large at $2.3 Bn (19.5% of the total $11.8 Bn total GF market), while the others are relatively small.
For additional information visit www.coatingsworld.com
Fragmentation
This consideration addresses an extremely fragmented and disjointed set of elements. The following table provides the complication in analytics, running through this deliberation.
Of the seven regions in this analysis totaling $11.8 billion U.S. dollars, the rank order in share of the global General Finishes marketplace are:
Asia/Pacific at 34% leads
Western Europe at 31%
NAFTA at 24%
Eastern Europe at 5%; South America; Middle East and Africa at 2% each are small but growing.
If Japan at $1.157 Bn was segmented out of the Asia/Pacific numbers, the order would be:
Western Europe at 31%
NAFTA at 24%
Asia/Pacific at 24%
Japan at 10%
Eastern Europe at 5%; South America; Middle East and Africa at 2% each are small but growing.
From a macro oversight, the (details) tells us that 11 of the 125 sub-segments analyzed represents 40.4% of the total value and another 8, totaling 19 sub-segments, would bring the percent share to 53.3% ($7.8 Bn) of the $11.8 Bn total.
Within the 40.4% (11 sub-segments) the range of size is $2.3 Bn (Metal Furniture) to the lowest $0.8 Bn for Wire Products.
Considering the compound average growth rates of the 24 major segments, we see the following pattern: Falling below the 4% CAGR are . . . . Marine, Metal Furniture, Tools, Hitches and Fabric/Textiles. Of these lower growth segments, one must be careful not to relegate too much weight to growth alone since, in this case, Metal Furniture at 3.9% CAGR is large at $2.3 Bn (19.5% of the total $11.8 Bn total GF market), while the others are relatively small.
For additional information visit www.coatingsworld.com